
# data orage is from R library
data(Orange)
# to summarize the data
summary (Orange)
Tree age circumference
3:7 Min. : 118.0 Min. : 30.0
1:7 1st Qu.: 484.0 1st Qu.: 65.5
5:7 Median :1004.0 Median :115.0
2:7 Mean : 922.1 Mean :115.9
4:7 3rd Qu.:1372.0 3rd Qu.:161.5
Max. :1582.0 Max. :214.0
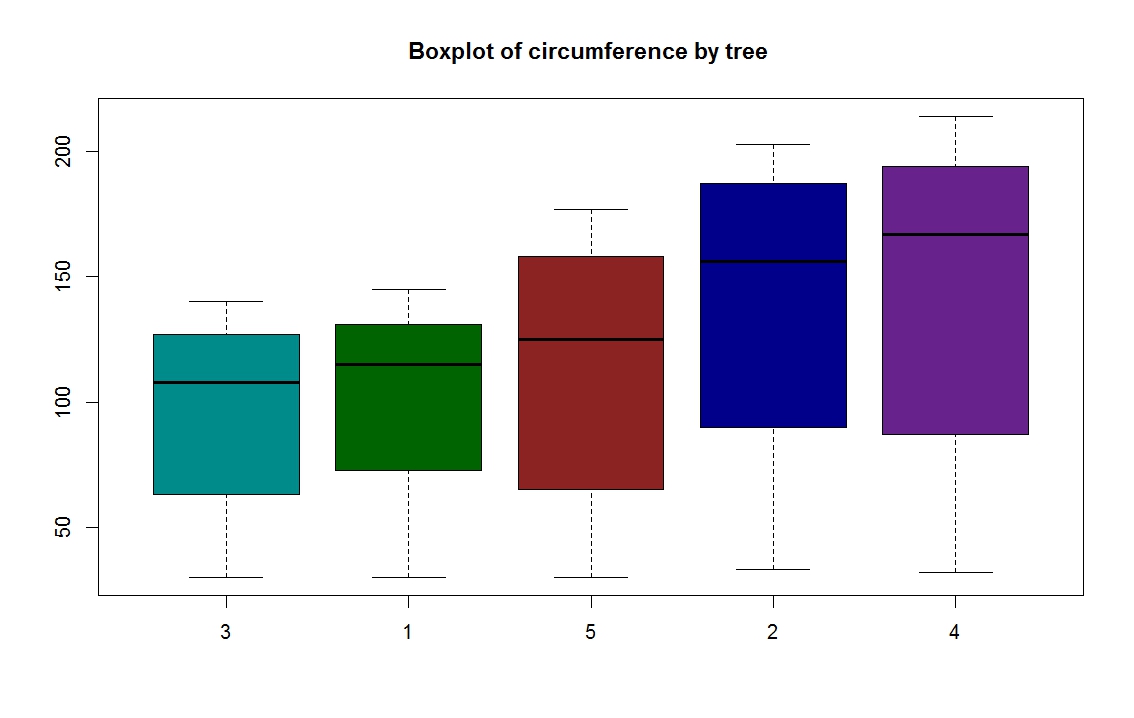
# defining own colors, for each group
mycol = c("darkcyan", "darkgreen", "brown4 ", "darkblue", "darkorchid4")
boxplot(circumference ~ Tree, data = Orange, main="Boxplot of circumference by tree ", col = mycol)
No comments:
Post a Comment
Note: Only a member of this blog may post a comment.